How to Test Your Website's Core Web Vitals
Learn how to measure web performance and what your scores mean for search and AI visibility, user experience, and lead generation.
 20 Min Read

A website can pass a performance audit and still underperform in search and AI results. That sounds contradictory until you see how a lot of organizations evaluate website performance.
A marketing leader receives a PageSpeed report. A developer sees technical recommendations. An agency points to an overall score. Everyone sees the data, but few people agree on what the data actually means.
"The most common issues we find are self-inflicted." ~ John Golden,
Lead Developer
Meanwhile, search rankings stall. Organic traffic plateaus. Mobile visitors abandon pages. Website lead generation fails to improve despite investments in SEO, content, and website enhancements.
The problem is rarely a lack of information. Most organizations already have access to performance reports. What they often lack is confidence in interpreting them. They wonder:
- Does this issue affect search visibility?
- Could it be hurting engagement?
- Is it creating a poor experience for potential customers?
- Should it be fixed immediately or monitored over time?
Those are business questions. Most performance reports answer them poorly.
The truth is, collecting performance data is relatively straightforward. The challenge is understanding what the data means, and what next steps it justifies.
The ability to connect performance metrics to visibility, engagement, and business outcomes is what turns a report into a decision-making tool.
Core Web Vitals help close that gap.
They provide a framework for understanding how real visitors experience a website and whether performance issues may be affecting visibility, engagement, and lead generation.
This article explains how to test Core Web Vitals, interpret the results, identify likely causes, and understand what the numbers are actually telling you.
Quick Reference: The Three Metrics You Will Be Testing
| Metric | What It Measures | Good Score |
| LCP | How quickly visitors see meaningful content | Under 2.5 seconds |
| INP | How quickly the site responds to interactions | Under 200 ms |
| CLS | How stable the page remains while loading | Under 0.1 |
Core Web Vitals explained: what they are, why Google uses them, and what they mean for search.
How to Test Core Web Vitals Using Google PageSpeed Insights
For most marketing leaders, Google PageSpeed Insights is the best place to start.
It combines Core Web Vitals reporting, real-user performance data, and diagnostic insights in a single interface. It also provides a useful starting point for identifying potential performance issues.

Test More Than Your Homepage
Enter a URL from any website into PageSpeed Insights.
Then test more than your homepage.
Key Pages to Evaluate
- Service pages
- Solution pages
- Product pages
- Resource center pages
- Blog templates
- Landing pages
Many organizations stop with the homepage and miss where performance issues exist.
The homepage often receives the most design and development attention. It may also represent only a small percentage of the traffic that matters.
A website can have a strong-performing homepage while the pages responsible for generating leads and attracting search traffic perform significantly worse.
Experienced teams look for patterns across templates, not isolated page scores.
Start With the Core Web Vitals Assessment
Before reviewing the overall performance score, locate the Core Web Vitals Assessment.
The first question is simple: Does the page pass or fail?
Many organizations focus immediately on the performance score at the top of the report. That score has value, but it is not the first thing to evaluate.
Google evaluates whether real users are having a good experience. That result differs from a Lighthouse score, which measures performance in a controlled testing environment and helps identify technical issues before they affect real visitors. Google evaluates whether users are having a good experience on the page.
The Core Web Vitals Assessment provides a clearer signal of actual user experience.
If the page fails here, the overall score becomes secondary.
Review LCP, INP, and CLS
Once you know whether the page passes or fails, identify which metric is responsible.
Largest Contentful Paint (LCP) measures how quickly users see the largest content on the page.
Target: Under 2.5 seconds.
When LCP fails, visitors wait too long for the page's primary content to appear.
Interaction to Next Paint (INP) measures responsiveness.
Target: Under 200 milliseconds.
INP replaced First Input Delay (FID) in 2024 and provides a more accurate picture of how responsive a website feels during real interactions.
When INP fails, users can see the page but experience delays when clicking, scrolling, navigating, or submitting forms.
Cumulative Layout Shift (CLS) measures visual stability.
Target: Below 0.1 seconds.
When CLS fails, content shifts unexpectedly while the page loads.
Users attempt to interact with the page, and elements move beneath them.
One failing metric often tells a more useful story than the overall score.
The question is not whether the score is red, yellow, or green.
The question is what the score suggests visitors are experiencing.
Compare Mobile and Desktop Performance
Review both reports.
Then spend more time with mobile.
Many B2B websites perform reasonably well on desktops but struggle on mobile devices.
This pattern appears frequently because websites are often reviewed internally on powerful computers connected to reliable networks.
Prospective customers rarely experience those same conditions.
A website that feels fast internally can feel noticeably slower to actual visitors.
That difference is one reason Google places so much importance on real-user performance data.
Review Opportunities and Diagnostics
PageSpeed Insights provides a list of opportunities and diagnostics.
Review them carefully.
Then resist the temptation to treat every warning as a separate problem.
Most websites do not have dozens of root causes.
A single issue can generate multiple warnings throughout the report.
Heavy templates, oversized media, inefficient scripts, and infrastructure bottlenecks often create cascading effects that appear across several categories.
The goal is not to collect warnings. The goal is to identify the root issues creating those warnings.
Google Search Console Reveals Broader Performance Patterns
PageSpeed Insights evaluates a single page at a time.
The Core Web Vitals report in Google Search Console helps you understand whether performance issues are isolated to one page or affecting larger sections of the website.
This distinction is important because widespread failures often indicate a shared issue rather than a problem with individual pages.
When reviewing the Core Web Vitals report, look for:
- Mobile versus desktop performance trends
- Groups of pages showing the same issue
- Changes following website updates
- Problems affecting a common page template or component
For example, if hundreds of product pages fail the same Core Web Vitals assessment, the cause is often a shared template, script, or infrastructure issue rather than hundreds of separate page-level problems.
Lighthouse Helps Identify the Cause of Performance Issues
Lighthouse is Google's diagnostic testing tool. It evaluates a page in a controlled environment and helps identify technical factors that may be affecting performance.
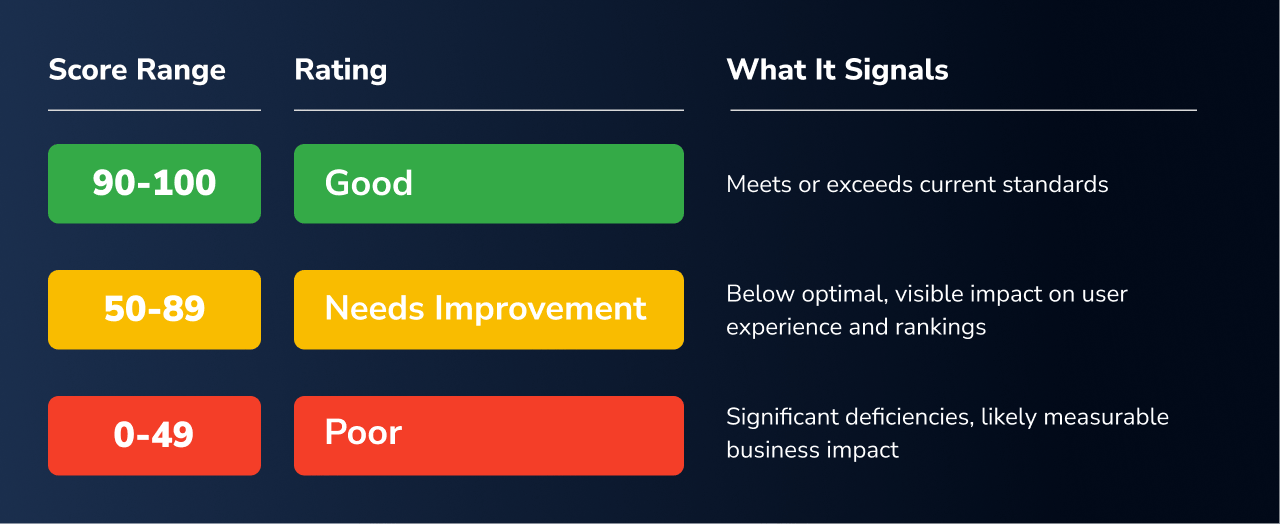
These scores provide useful context, but they should not be viewed in isolation from Core Web Vitals data.
Because Lighthouse uses a simulated testing environment, its results are most useful for troubleshooting and optimization.
Core Web Vitals measure how users actually experience a website. Lighthouse helps explain why performance issues may be occurring.
Together, they provide a more complete picture of website performance.
Internal Link Opportunity: Complete Guide to Lighthouse Performance Testing
Understanding What Your Results Are Telling You
Most Core Web Vitals failures follow predictable patterns. The goal is not simply identifying a failing score.
The goal is understanding what that score reveals about the experience real visitors are having.
When LCP Is Failing
When LCP fails, visitors wait too long to see the content they came for.
Common causes include oversized images, slow hosting, delayed server responses, heavy page templates, and render-blocking resources.
Questions worth asking
Are large media files affecting load times?
Is infrastructure contributing to delays?
Have templates become heavier over time?
When INP Is Failing
When INP fails, the website appears available but feels slow to use.
Excessive JavaScript, third-party tools, frontend processing delays, and interactive elements competing for resources are common contributors.
Questions worth asking
How many third-party tools are running?
Have new features been added without a performance review?
Are legacy scripts still loading?
When CLS Is Failing
When CLS fails, content shifts unexpectedly while the page loads.
Images without reserved dimensions, dynamically loaded content, embedded media, and unstable layouts are common causes.
Questions worth asking
Are content blocks loading after the page begins rendering?
Are promotional elements shifting page layouts?
Are templates behaving consistently?
When Multiple Metrics Are Failing
Multiple failures often point to broader performance challenges rather than isolated issues.
This is where many organizations struggle.
A report may contain dozens of warnings, creating the impression that dozens of independent problems need attention.
In reality, a small number of underlying issues often create performance drag across multiple metrics.
What Experienced Teams See Most Often
Many performance problems do not arrive with a major redesign, platform migration, or system update.
They accumulate gradually.
A large image uploaded without compression. A heading tag chosen for appearance rather than structure. An outdated analytics script that continues running years after implementation.
None of these decisions feels significant individually.
Together, they reduce performance across multiple areas of a website.
These patterns appear frequently during monthly website maintenance reviews.
John Golden, lead developer at DBS Interactive, sees them regularly when reviewing client websites. The culprits are rarely dramatic.
"The most common issues we find are self-inflicted," Golden says. "Someone uploads a full-resolution image directly from their camera or phone, and suddenly you have a 6-megabyte file doing the job a 200-kilobyte file could handle. It happens frequently, and it hits LCP hard."
Oversized images remain one of the most common causes of poor loading performance.
Other issues are less visible.
Missing alt text can weaken accessibility and SEO signals. Heading tags selected for visual appearance rather than document structure can create usability and search-performance issues. Legacy tracking scripts and outdated third-party tools often continue running long after they stop providing meaningful value, quietly affecting performance scores.
The pattern is rarely a technical failure.
It is accumulated neglect.
Performance is not established at launch and left alone. It is shaped by hundreds of small decisions that either preserve or erode the user experience over time.
Testing Core Web Vitals once reveals a snapshot. Testing monthly reveals a pattern. Content updates, plugin additions, new tracking scripts, and infrastructure changes all affect performance over time.
A site that passes today can fail quietly within weeks. Monthly monitoring catches issues that drift before they compound into a ranking or conversion problem.
The Core Web Vitals Mistake Many Companies Still Make
Many organizations spend too much time looking at test scores and not enough time evaluating the real user experience.
Lab Data vs. Field Data
Lab data comes from simulated testing environments such as Lighthouse.
Field data comes from real users on real devices using real networks. Google's Core Web Vitals evaluation is based on field data.
That distinction matters.
A website can perform well in a controlled test while delivering a poor experience to actual visitors.
Many organizations spend time optimizing scores that are useful for diagnostics while overlooking the field data Google actually evaluates.
When strong Lighthouse scores appear alongside weak field data, the website often performs well under ideal conditions but struggles in real-world environments.
Many companies have spent months optimizing for a score Google does not use to rank their pages.
Why Marketing Leaders Pay Attention to Core Web Vitals
Core Web Vitals are not just technical metrics.
They influence outcomes marketing teams care about.
| Search Visibility - Performance directly shapes search visibility. Sites that fail field data thresholds face ranking drag that compounds over time, regardless of how strong the broader SEO strategy is. |

| AI Visibility - As AI-driven search experiences grow, fast and stable websites surface more reliably in AI-generated responses. A site that fails Core Web Vitals thresholds creates friction not just for human visitors but for the retrieval systems evaluating it. |

| User Experience - Fast, stable websites reduce abandonment and improve engagement. |

| Lead Generation - Performance issues often appear during high-intent interactions such as form submissions, quote requests, and product research. |

| Buyer Confidence - Website responsiveness and stability influence how prospective customers perceive the organization behind the experience. |

Testing Is Straightforward. Interpretation Creates Value.
Most organizations already have access to the data. What they sometimes lack is confidence in interpreting it.
The ability to connect performance metrics to visibility, engagement, and business outcomes is what transforms a report into a decision-making tool.
Most B2B websites do not have a performance problem. They have an interpretation problem. The data has been there for months. No one connected it to the pipeline.
Understanding the patterns helps determine what to do next.
Translating the Report into Meaningful Action
- Start with field data.
- Real-user experience should take priority over isolated lab warnings.
- Look for patterns before individual issues.
- Recurring problems often reveal more than isolated pages.
- Focus on high-impact templates.
- Improving one template may improve hundreds of pages.
- Avoid chasing perfect scores.
- The objective is not a perfect report.
- The objective is to deliver a better user experience and stronger business outcomes.
The performance report is rarely the problem.
From Metrics to Meaning
A marketing leader who has worked through this process can now do something most performance reports do not enable.
- Understand what Core Web Vitals measure
- Test your website confidently
- Identify likely causes behind poor scores
- Recognize meaningful performance patterns
- Have more productive conversations with developers and agencies
Understand What's Really Affecting Website Performance
If Core Web Vitals are failing, the next question is not whether a problem exists. The next question is which issues matter most, what is causing them, and how they may be affecting visibility, engagement, and lead generation.
A Core Web Vitals assessment should provide: analysis of real-user performance data, identification of likely root causes, prioritization of performance issues, interpretation of business impact, and a clear path toward improvement.
The goal is not another report. The goal is understanding what visitors are experiencing and what deserves attention first.
Ready to See What Your Field Data Actually Shows?
Understanding Core Web Vitals is the first step. Knowing which issues are affecting your specific site, your rankings, and your lead generation is the next step.
A Core Web Vitals assessment from DBS provides a review of real-user field data, identification of the most likely causes, and a clear conversation about what deserves attention first and why.
No generic report. No list of warnings without context. A prioritized diagnosis tied to the outcomes that matter to your business.
Related Posts