

How to Audit Websites Using Lighthouse in Chrome Browser
Lighthouse is an automated website auditing tool that helps developers diagnose issues and identify opportunities to improve the user experience of their sites. It measures several dimensions of user experience quality in a lab environment, including performance and accessibility.
The latest version of Lighthouse measures all three Core Web Vitals as well as other components of your website’s performance, including SEO and Progressive Web App (PWA) requirements.
How to Use Google Lighthouse in Chrome Browser
Once you have downloaded and opened Google's Chrome browser, here are step by step instructions on easily accessing the Lighthouse website auditing tool through the DevTools panel:
-
Open Browser in Incognito Mode
Make sure your browser is in Incognito mode, otherwise your performance metrics can be skewed by extensions or other data stored in your normal browser.
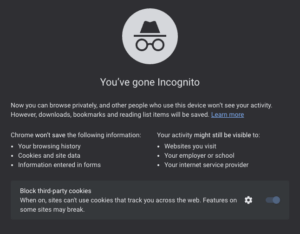
Running Lighthouse in Incognito Mode ensures your results aren't skewed
-
Go to the Website You Want to Audit
In the Incognito browser, enter the URL of the website page you'd like to test in Lighthouse and open the page.
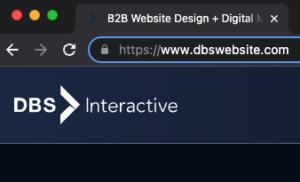
Enter or copy/paste the URL of the page you want to test
-
Open the DevTools Panel
Right click anywhere on the page and choose "Inspect" from the dropdown menu.
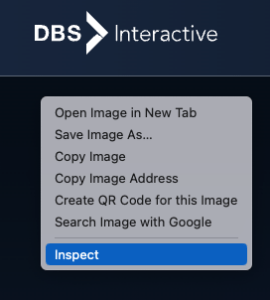
Choose "Inspect" from the right-click dropdown menu
-
Choose the Lighthouse Tab
From the tabs at the top of your Chrome DevTools panel, choose "Lighthouse" to open the Lighthouse panel.
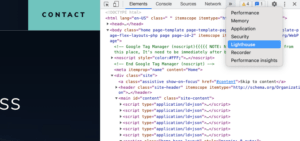
From the DevTools tab menu, choose Lighthouse
-
Select Options and Analyze the Page
Choose what you'd like Lighthouse to audit for the page, including Performance, Accessibility, Best Practices, SEO, and Progressive Web App requirements.
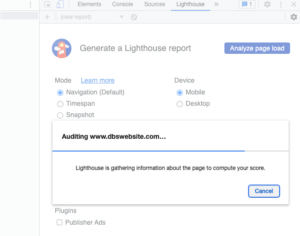
Click "Analyze page load" to run the Lighthouse test
-
See Your Scores
Once the Lighthouse audit completes, you should see the results for the website page you audited. If there were any issues preventing testing, you should see error messages along with explanations for each issue. You can also explore each scoring category to see how the page performed for each item tested in the audit.
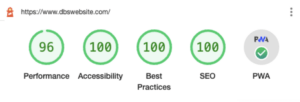
Lighthouse returns your scores in five categories
Let's Talk About Your Web Performance
Most businesses are unaware of the lost opportunities they miss by having an underperforming website.
At DBS, we have decades of expertise building high-performance, enterprise-level websites for B2B, manufacturing, and healthcare brands.
Connect with us if you want to learn how we turn your B2B website into a lead-generating, brand-elevating machine.


