Understanding Online Metrics
Metrics are an essential tool in the online marketer’s tool bag. Without a firm understanding of metrics, online marketers can never fully realize the potential of their advertising campaigns.
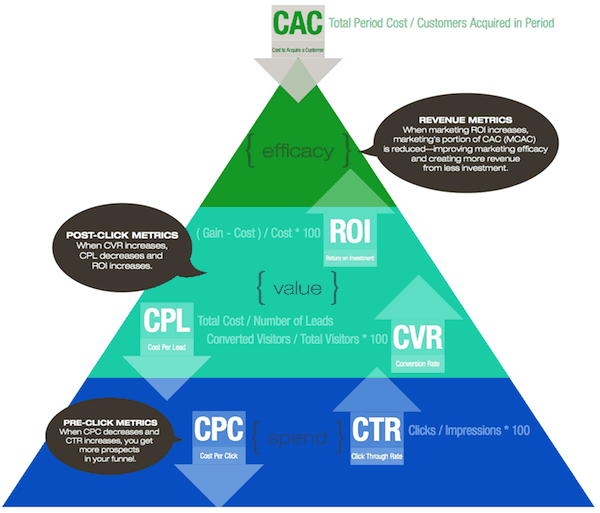
To help us understand some of the more commonly used metrics and how they relate to one another, let’s use the Digital Marketing Metrics pyramid developed by Ion Interactive:

Pre-Click Metrics
The most common metrics used in online advertising are click-through rate and cost-per-click. It is almost always preferable to have a large click-through-rate and a low cost-per-click.
Click-through rate (CTR) is calculated based on a simple ratio, # of Clicks / # of Impressions. Advertisers attempt to create ads that will increase the number of clicks while maintaining or decreasing the number of impressions. Ads with high CTRs suggests that your ad copy is compelling, but the weakness of these pre-click metrics is that they add little in helping advertisers understand the quality of the click.
Cost-Per-Click (CPC) is also calculated, but its explanation may be better saved for another blog post. For simplicity’s sake, cost-per-click can be thought of as the price that advertisers must pay each time that someone clicks on their ad. Whether or not the click was worth the cost is largely dependent on the next set of metrics, Post-Click Metrics.
Post-Click Metrics
Clicks do not always lead to conversions or sales. Therefore, marketers need other metrics to help them assess what happens once an individual clicks an ad and arrives on their website. The two most common post-click metrics used to assess the quality of a lead are conversion rate and cost-per-lead.
Conversion rate is the percentage of total clicks that led to a sale or conversion. As a metric it is best used to determine the degree that users find your offer compelling. A high conversion rate suggests that your offer and your post-click experience are effective. A low conversion rate suggests that your post-click experience may not live up to your offer. If the latter is the case then marketers should work toward improving the post-click experience. This could take the form of lower prices, better customer service, or a more streamlined user experience.
Cost-Per-Lead (CPL) is a metric that takes into account conversion rate and CPC to calculate the cost per sale. Assuming that your user experience is fixed and that the CPC is largely variable -- Cost-Per-Lead (CPL) improves only when you improve your conversion rate.
Revenue Metrics
The end goal of all of this tomfoolery is to calculate metrics that have real world business value. If you understand the relationships between pre-click, post-click, and revenue metrics, you are then able to make informed business decisions based on actual data. The one caveat is that revenue metrics are often tricky to calculate.
Return on Investment (ROI) is a metric used to measure the revenue achieved from your online marketing tactics in acquiring new customers. It’s challenging to calculate primarily because not all actions are easily tracked. Any offline action that results in a sale cannot be included in the calculation, unless there is a definite way to tie it to an onsite offer. Business owners should establish processes to attribute these offsite actions with onsite offers.
Cost to Acquire a Customer (CAC) is a metric that is even harder to quantify, but when done so correctly, gives business owners a glance into their online profitability. CAC can roughly be defined as all sales and marketing costs for a time period divided by the number of customers won for that period. The difficulty with this metric is not only do you need to account for all sales influenced by online ads, but you also need to know when they were first exposed to the offer. An example of the time problem is if you are calculating a period starting Jan 1, you can't know if their actions on January 2 were influenced by an ad they saw the previous December.
The takeaway from all of this is that no one metric is going to provide you with all the answers. Business owners should do their best to monitor all six metrics, and should pay special attention to any observed change.


