
Google Analytics Made Easy: New Visitors vs. Returning Visitors
One of the most powerful tools in your digital tool belt is also one of the most complicated to understand. Google Analytics is data-rich, but is only as valuable as your ability to interpret it. This is why we’re bringing you our Google Analytics Made Easy (GAME) series. Explanations of the most telling data on your Google Analytics dashboard--easy to read, easy to understand, and without the fluff. Game on!
Google Analytics provides a wealth of information about your site’s audience, from the age of your users to the flow of visitors around your site. A key (but often overlooked) audience demographic is your proportion of new and returning visitors to your site. Spend a little time analyzing your data, and you can be a savvy analytics-nerd, too!
The Difference Between New and Returning Visitors
We know the difference between new and returning visitors seems pretty self-explanatory, and for the most part, it is! But Google does differentiate between the two a little differently than you and I might.
New Visitors are those navigating to your site for the first time on a specific device. If you visit our website from your desktop computer at work, and then visit our website again from your iPhone, Google Analytics would record you as 2 new users. (Google is getting smarter about this—if you’re logged onto your Google Chrome browser and repeat the actions above, you would be recorded as a New Visitor on your desktop, and a Returning Visitor on your iPhone.)
Returning Visitors have visited your site before and are back for more! Google sets a 2-year expiration date on New Visitors. If someone has visited our website within the past two years and returns from the same device, they are marked as a Returning Visitor in our Google Analytics. If it has been more than two years since someone has visited our site, the next time they return they will be counted as a New Visitor again.
First: Where Do I Find the Data?
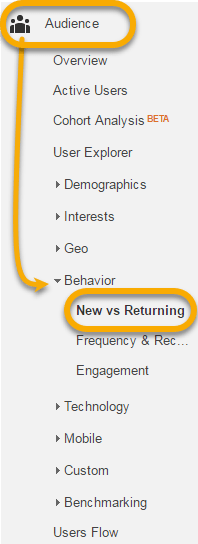
On your Google Analytics dashboard, select “Audience” on the left. Then click the “Behavior” drop down and select “New vs. Returning.”
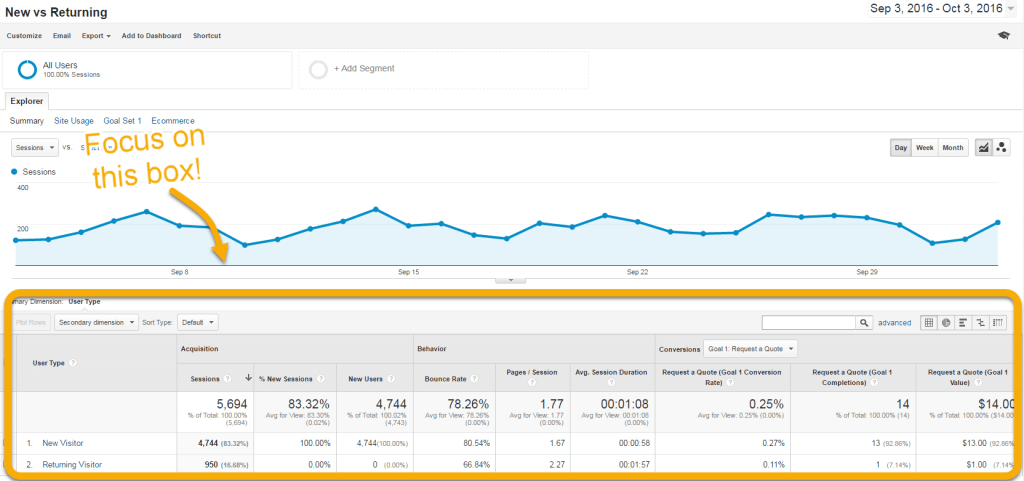 You’ll see a screen that looks like this. The chart at the top simply maps out daily sessions for the past month (useful data, but not too relevant for comparing New and Returning Visitors). Your focus should be on the table at the bottom. That’s where you’ll find the most useful data!
Three Key Pieces of Data: Sessions, Behavior, Goals
There are three key pieces of data to review in this table:
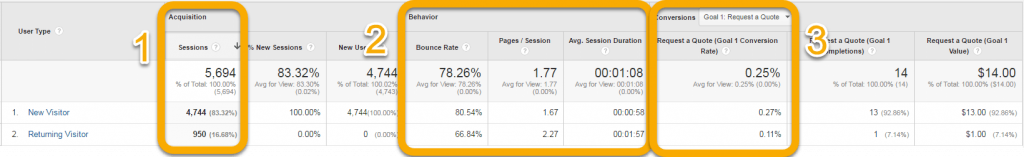
- Sessions – compare how many new visitors your site gets versus the number of repeat visitors. You can see the total number of each visitor type here and the percentages of each. Your goals will depend on the type of business you’re in and the type of website you have. If you run a content-heavy website (like a professional blog), you’ll want a solid number of returning visits from people who come back for new content. Niche e-commerce businesses might want mostly new visitors. “Brochure Websites” that simply point users to an in-person store or service probably have very few returning visitors, and that’s okay. If you’ve run a heavy digital marketing campaign in the past month, you’ll want to look at your numbers compared to last month’s—if your campaign has been successful, you’ll see more new visitors this month!
- Behavior – This section breaks down how returning users and new users behave once they’re on the site. “Bounce rate” refers to the percentage of users who leave the site without visiting a second page. “Pages / Session” tells you how many individual pages the average user visits on your site before leaving. “Avg. Session Duration” tells you the average length of time each visitor spends on your site before leaving.
- Goals – If you’ve set up goals on your site through Google Analytics (e.g. signing up for a newsletter, making a purchase, or clicking on a CTA button), this data will let you see whether New Visitors or Returning Visitors are “completing” that goal more often.
It’s this behavior and goal information that makes the breakdown between New and Returning visitors so insightful. In the table you can compare side by side each of these metrics for your New Visitors and your Returning Visitors. Again, it’s impossible to have a universal benchmark you should aim for, but you can still draw some really powerful conclusions here.
Interpreting New and Returning Visitors Data
For example, if your New Visitors spend far more time on your site than your Returning Visitors, you may want to incentivize first-time visitors to return again. Offer a new coupon code to shoppers after their first purchase or work your email lists to push new, relevant content to your base. This data could also be indicating a site has poor design, but quality content. Your site may have important content that many people want to read, but a poor user interface means visitors slowly have to “learn” how to find the content they want.
If Returning Visitors have higher goal completion rates than your New Visitors, consider strategies that push New Visitors toward goal completion. Use best practices for your call-to-action buttons to maximize your opportunity. Exit popups can also be useful if used sparingly. For e-commerce sites, new shoppers may need more product information (or a comparison table) to make a decision on their first visit.
If Returning Visitors have a higher bounce rate than New Visitors, it’s possible that the quality or the quantity of your content is decreasing. Visitors are returning to the site but no longer finding useful content. Review your content strategy and performance of recent content to see if something is amiss. Immediately following a major redesign, many sites experience higher bounce rates from returning visitors unfamiliar (or unhappy) with the new site navigation and layout. Returning visitors are key to building a strong brand and an engaged digital community, so make sure you are giving them a reason to keep coming back!
Can I Trust my Google Analytics Data?
Google Analytics provides powerful data to aid in making decisions about your business’s digital presence, but remember that it’s only one piece of the puzzle. Important strategic decisions require a long-term focus that might be skewed by a month’s-worth of data. Content marketing strategy requires persistence—changing your type or frequency of content based only on bad numbers in November could be disastrous. By combining your Google Analytics data with social media metrics and internal business data, you’ll get a clearer, more holistic picture of your organization's digital traction. Of course, it can’t hurt to bring in some experts to help you set up and analyze your Google Analytics data.
Remember that the amount of data you're analyzing can affect the accuracy of your data. If you run a personal website with only 50 monthly hits, you probably can’t make any conclusive insights—there’s a large degree of uncertainty built into the data you see. Your data becomes more valuable as you increase the number of sessions your website receives monthly and the length of time you have to measure.
On the other hand, if your site has been getting 1,000 visitors each month for the past year, you can draw pretty accurate conclusions from your data (and for sites above this threshold, too). Less data doesn’t mean you should ignore that data, just that you should always take it with a grain of salt.
Quick Recap: New Visitors vs. Returning Visitors
A key audience demographic on your Google Analytics dashboard is the breakdown of New Visitors vs. Returning Visitors. New visitors are people who are coming to your site for the first time on a device. Returning visitors have come back to your site before. The ratio of new visitors to returning visitors can be very telling, showing the effectiveness of your inbound digital marketing techniques across the web. Looking at behavioral data for these two groups provides valuable insights about your website content, structure, and design, and it can reveal new opportunities for providing value to your audience.
RELATED READ: Google Analytics Made Easy: Frequency and Recency
Related Posts