Understanding Core Web Vitals and How They Influence SEO
We simplify and explain Core Web Vitals, why Google treats them as search ranking signals, and how they affect SEO for websites.
Google’s Core Web Vitals comprise three key metrics: Largest Contentful Paint (LCP), Interaction to Next Paint (INP), and Cumulative Layout Shift (CLS), which measure how fast, responsive, and visually stable your website is for users.
What it means to you: These metrics are now a direct ranking factor for SEO, meaning slow or unstable sites can lose search visibility and traffic. LCP tracks how quickly the main content loads (good is under 2.5 seconds), INP measures how fast your site reacts to user actions (good is under 200 milliseconds), and CLS gauges whether content shifts around as the page loads (good is below 0.1).
Optimizing these scores improves your Google rankings, keeps users engaged, boosts conversions, and drives more revenue. In short: Fast, stable, and responsive sites win, both in search and user satisfaction.
Since 2021, Google has used Core Web Vitals as ranking factors. With the rise of AI-powered search engines, fast, user-friendly pages with good Core Web Vitals scores are now more critical than ever for visibility.
Google's Core Web Vitals comprise three key performance metrics: Largest Contentful Paint (LCP), Interaction to Next Paint (INP), and Cumulative Layout Shift (CLS). These directly affect your website's search rankings and user experience, because they measure how quickly your site loads, how responsive it is to user actions, and how visually stable it remains as content loads.
- LCP tracks the time it takes for the main content to load (good: under 2.5 seconds).
- INP measures how quickly your site responds to user interactions throughout the visit (good: under 200 milliseconds).
- CLS gauges how much content shifts unexpectedly during loading (good: below 0.1), which is especially important for mobile users.
Poor scores can harm your SEO, drive away visitors, and lower conversions. For example, every one-second delay in mobile load time can drop conversions by up to 20%. To improve your scores, optimize images and hosting for LCP, streamline code and event handling for INP, and reserve space for media and ads to prevent layout shifts for CLS.
What it means to you: Core Web Vitals are essential for search visibility and user satisfaction. Prioritizing them means better rankings, higher engagement, and more business growth.
DEEP DIVE: Google’s UX Metrics Quietly Reshaped the SEO Game
When it comes to SEO, page speed and user experience are no longer technical afterthoughts. Once Google’s Page Experience update in 2021 changed how websites are evaluated, directly tying a website's Core Web Vital performance scores to its search visibility, great UX became essential to online success.
If your site has lost traffic in the years since, subpar Core Web Vitals are a potential culprit. In fact, optimizing Core Web Vitals is now an essential part of Generative Engine Optimization (GEO) because AI platforms like ChatGPT, Claude, Microsoft Copilot, and Google Gemini often extract answers directly from top-ranking, fast-loading websites.
Even in the age of generative AI, fast, user-friendly pages remain vital to search visibility. They ensure your content is easily discoverable and favored by these answer-driven algorithms. This is a primary factory in what's called technical SEO.
But what are Core Web Vitals, and why does it matter for SEO? Simply put, it’s a framework of page experience metrics that Google uses as a ranking factor, meaning fast and user-friendly sites get a boost in search results.
"Optimizing for Google Core Web Vitals means building websites that load fast, respond instantly, and stay reliable—every time," said John Golden, the lead developer at DBS Interactive, a Louisville-based agency.
And beyond rankings, speed and responsiveness have a tangible impact on your bottom line. Slow sites drive visitors away, hurting conversions and sales.
In this article, we’ll break down the latest on Core Web Vitals, why they matter for your business, common challenges, and how to improve these vitals to enhance your SEO (and GEO) core strategy.
Why Core Web Vitals Matter for Your Business
Core Web Vitals are more than just technical benchmarks. They represent vital data about your users’ experience. A site that loads quickly and responds fast keeps users engaged, leading to higher conversion and lower bounce rates.
From a business perspective, this means better user satisfaction and more revenue. Critically, Google has confirmed that Core Web Vitals directly influence your SEO rankings. In fact, since 2021, Google’s algorithm has used these metrics as a page experience signal, so poor vitals can drag down your search visibility.
"Optimizing for Google Core Web Vitals means building websites that load fast, respond instantly, and stay reliable—every time." — John Golden
Imagine a potential customer clicking your link on Google only to abandon it because the page is sluggish. You lose that potential lead, and Google’s AI-powered ranking systems take note. Studies back this up: every one-second delay in mobile page load can drop conversions by up to 20%.
In other words, improving Core Web Vitals isn’t just about appeasing Google’s algorithms. It’s about delighting your users and driving business results. Core Web Vitals provide the measuring stick for that success, so ignoring them means leaving both rankings and revenue on the table.
What Are Core Web Vitals?
Core Web Vitals are a set of three key performance metrics defined by Google to quantify user experience by measuring loading speed, interactivity, and visual stability. Put another way, Core Web Vitals measure how fast your website's content shows up, how responsive your pages are when users try to interact with them, and how stable the website is when users browse, navigate, and interact with content.
Website owners should understand how each Core Web Vital metric provides insight into the quality of their site's user experience across various site pages. These pages may have very different formats, content, and functionality, so gathering Core Web Vitals data for all your site's pages is essential.
Improving these scores can increase your search rankings and improve UX enough to increase conversions, helping your site generate more leads or sales for your business. Updated in 2024, Core Web Vitals consists of three pillars:
1. CLS (Cumulative Layout Shift)
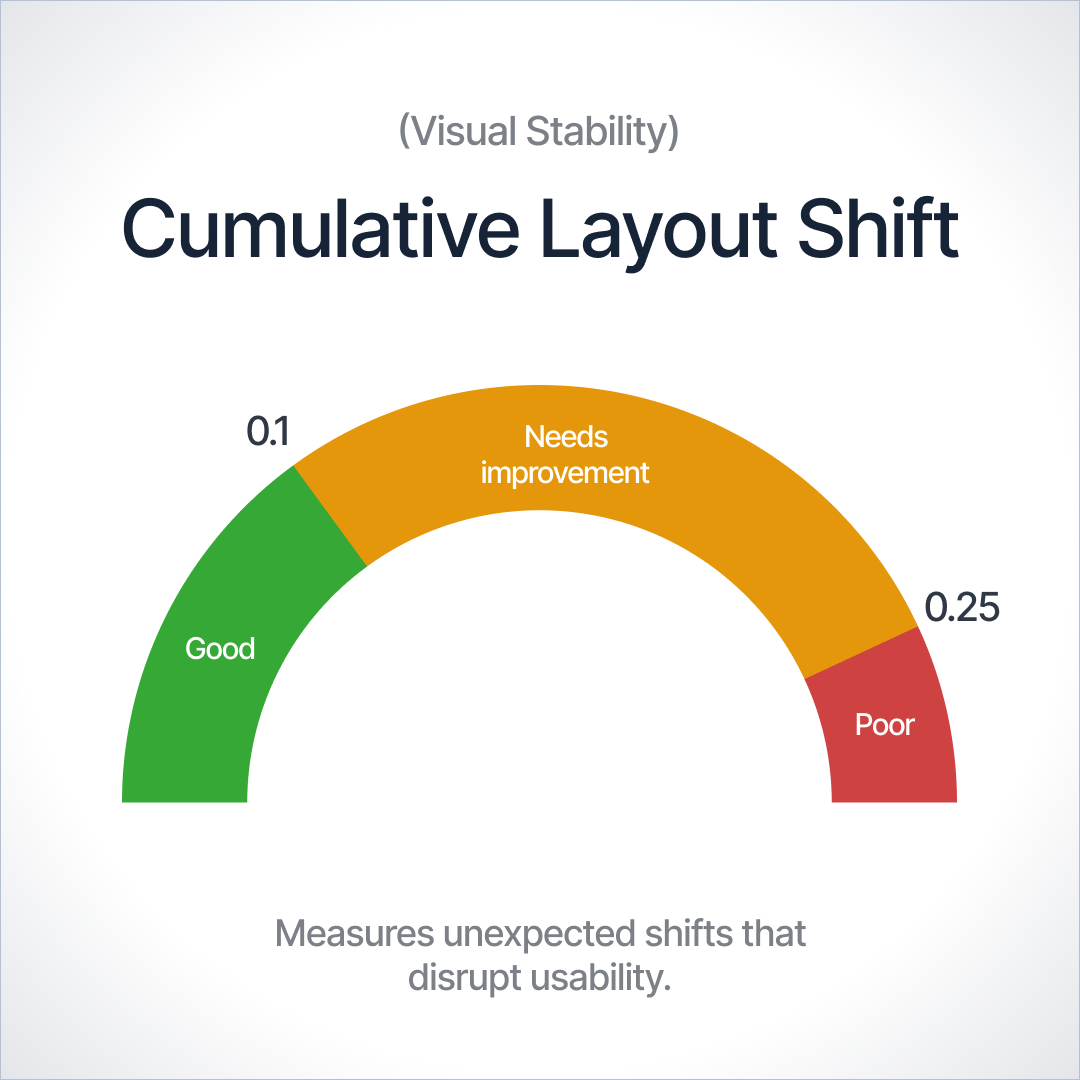
This metric represents visual stability. CLS measures how much the page’s content unexpectedly shifts during loading. If you’ve ever tried to click a link and suddenly the page jumps, causing you to click something else, that’s what CLS captures. A stable page keeps content in place, preventing frustrating “jumpy” experiences. Google says a good CLS score is 0.1 or less, while a score above 0.25 is poor.
High CLS often comes from images or ads with no set dimensions or other dynamic content that pushes things around. Minimizing these issues, for example, reserving space for images/ads or avoiding inserting new DOM elements above existing content, will improve visual stability and, thus, your CLS.
This is often an overlooked aspect of SEO; we could call it the “SEO CLS” concern because if your layout is unstable, it annoys users and impacts your page’s performance in search.
CLS measures the visual stability of web pages
Cumulative Layout Shift (CLS) measures how stable a page is as it loads and achieves “visual stability.” CLS, in particular, is a very mobile-centric Core Web Vitals metric since screen size challenges are mostly non-existent on desktop websites.
CLS specifically measures how often page elements “shift” on screen when that makes it more difficult for users to interact with content on smaller mobile screens.
Ads, images, and other layout elements rendered after the user has begun interacting with and navigating the page content are some typical causes of shifting screen elements.
The bottom line is that if elements on your page move around too much as the page loads, you've got a high CLS, which is bad. CLS scores are divided into three categories.
Evaluating CLS Results
- Good - CLS score if it's below 0.1.
- Needs Improvement - CLS score needs improvement if it's below 0.25, but above 0.1.
- Poor - CLS score that's above 0.25 needs significant work.
How to Minimize CLS
Google offers three recommendations for improving your page's CLS score.
Use set size attribute dimensions for any media on the page (video, images, GIFs, graphics, etc.) When you use set size attributes for visual media, the user’s browser knows precisely how much space that element will take up on that page. Additionally, the size won’t change randomly as the page fully loads. Setting these attributes ensures an optimal CLS score.
Make sure ad elements have a reserved space. If your page design doesn't include space for ad elements, they can suddenly appear on the page, pushing content down, up, or to the side. This will increase your CLS.
Add newly rendered UI elements “below the fold.” When you add newly rendered UI elements below the fold, they don’t push content down, ensuring it stays where the user “expects” it to stay, and your CLS stays lower.
2. Interaction to Next Paint (INP)
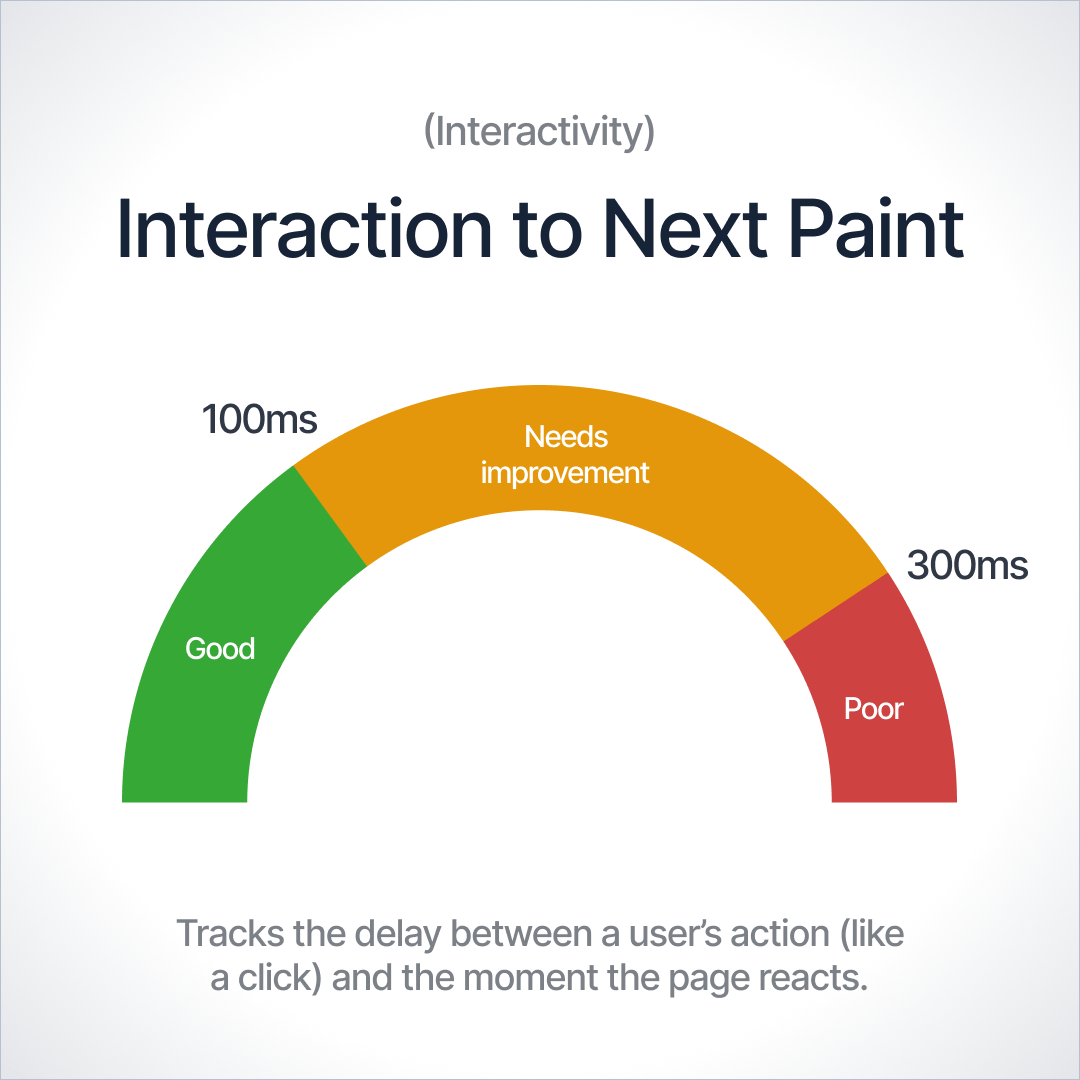
This is the newest Core Web Vital focused on responsiveness. INP measures the delay between a user’s interaction, like clicking a button or tapping a link, and the following screen update when the browser responds with a visual change.
It gauges how quickly your site reacts to user input, not just for the first interaction but throughout the page’s usage.
Google introduced INP as a replacement for the older First Input Delay (FID) metric to address FID’s limitations by looking at all interactions, not just the first one.
A good INP score is under 200 milliseconds, meaning your site feels almost instantaneously responsive to a tap or click. An INP above 500 ms is considered poor.
Interaction to Next Paint, or INP, measures the time from a user's input (such as a tap, click, or key press) until the next frame is painted – essentially how long it takes the page to respond to that interaction visibly.
Google officially replaced the old First Input Delay (FID) metric with INP in March 2024. Unlike FID, which only captures the delay of the first user interaction, INP tracks all user interactions on a page and reports a single responsiveness score reflecting the worst delay among those interactions.
This more comprehensive measure ensures that if any part of the user journey is sluggish, the INP metric will flag it.
Evaluating INP Results
Google defines clear benchmarks to interpret your INP score.
- An INP of 200 milliseconds or less is considered “good.” The page is very responsive to user input.
- An INP between over 200 ms and 500 ms is labeled as “needs improvement,” indicating that some users may notice lag.
- Anything above 500 ms is deemed “poor,” meaning the page often feels unresponsive.
These thresholds are typically evaluated at the 75th percentile of page loads, so the goal is for at least 75% of your visitors to experience good responsiveness.
How to Improve INP
If your INP needs work, several actionable steps are necessary to boost responsiveness and provide a faster user experience. Consider the following practices:
- Break up long tasks and use background threads: Avoid running huge scripts or doing all your work in one chunk on the main thread. Split up large JavaScript tasks into smaller, asynchronous pieces. For example, using requestIdleCallback () or setTimeout gives the browser breathing room to process user events. Likewise, offload complex computations to Web Workers, which run in the background on a separate thread, ensuring the main thread stays free to respond to inputs promptly.
- Optimize third-party scripts: Audit your third-party integrations and remove or delay any that aren’t truly necessary. Each additional analytics tracker, ad script, or widget can hog the CPU or add network waits, so limiting these will help keep your main thread clear. If you rely on third-party code, use efficient versions and load them to minimize blocking, for example, using async/defer for scripts.
- Streamline your code and DOM: Simplify the page so the browser has less to chew on during interactions. Remove unused CSS and avoid massive DOM sizes or deeply nested layouts that slow rendering. A leaner DOM (fewer elements) and lighter styles/scripts mean the browser can calculate layouts and paint updates faster in response to user input. Also, be cautious with large libraries or frameworks – only use what you need to keep your site snappy.
- Prioritize critical interactions: Make sure the code that responds to user inputs is treated as a high priority in your page load sequence. Load essential scripts early (for instance, using <link rel="preload"> for a crucial UI script) and defer non-essential resources so they don’t delay the interactive parts of your site. By prioritizing what truly matters for interactivity, you ensure that when a user clicks a button, the necessary code is ready to run without undue waiting.
- Optimize event handling: Review how your site's event listeners and handlers are implemented. Ensure you aren't doing heavy work inside a click or keypress handler—keep those functions lean and efficient. If you have many elements, each with its own event listeners, consider using event delegation (attaching a single listener on a parent element to handle events from child elements) to reduce overhead. Efficient event handling means the browser can quickly execute your code and update the interface immediately after user interaction, improving INP.
3. LCP - Largest Content Paint
This metric tracks loading performance. LCP measures how long it takes for the largest content element, like a hero image or heading text, to render on the screen. A fast LCP reassures the user that the page is useful and worth waiting for.
Google considers an LCP of 2.5 seconds or less as good, while anything above 4.0 seconds is poor. In practical terms, if your main content hasn’t loaded within a couple of seconds, users might get impatient or leave.
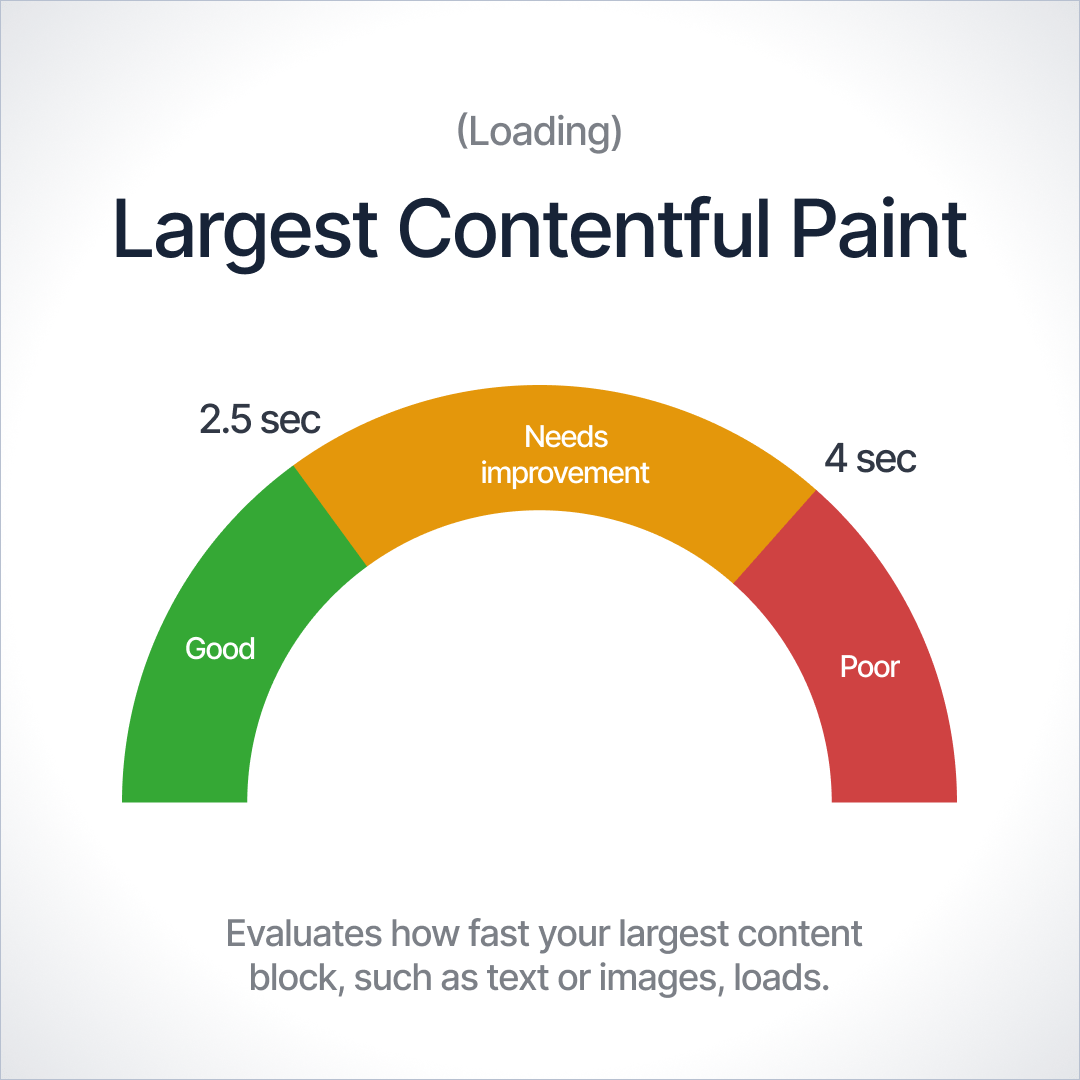
LCP measures how quickly your page loads content
Longest Contentful Paint (LCP) refers to how long it takes a page to load from the point of view of an actual user.
It measures the time from clicking on a link to seeing most of the content on-screen.
The time it takes for the largest content element (usually an image, graphic, or video) to render on the page is specifically referenced.
You can check your LCP score using Google PageSpeed Insights tool and the Lighthouse audit tool. Google has specific LCP guidelines.
Evaluating LCP Results
- Good - The largest content element renders in under 2.5 seconds.
- Needs Improvement - The largest content element renders in under 4 seconds but takes longer than 2.5 seconds.
- Poor - The largest content element takes longer than 4 seconds to render.
If at least 75 percent of page views to a site meet the "good" threshold, the site is classified as having "good" performance for the LCP metric.
Conversely, if at least 25 percent of page views meet the "poor" threshold, the site is classified as having "poor" LCP performance. So, for example, a 75th percentile LCP of 2 seconds is classified as "good", while a 75th percentile LCP of 5 seconds is classified as "poor."
How to Minimize LCP
Google offers four recommendations for improving your page's LCP score:
- Remove third-party scripts you don’t need
Third-party scripts significantly slow down page loading speed, yet they are still common on websites because website owners want insights and the ability to generate revenue online. Each third-party script added to a page typically increases the load time by 34.1 milliseconds, and these can add up quickly when you think of how many tools are commonly added to sites, such as analytics, ad software, eCommerce, and more.
- Upgrade your web hosting service. Better hosting leads to faster load times, resulting in better overall UX
- Lazy-load your images. Lazy loading makes it so that images on your site only load when someone scrolls down your page. This feature helps your pages achieve LCP significantly faster, especially if your pages have a lot of visual media such as photos, images, graphics, or videos.
- Remove or compress large page elements. Google PageSpeed Insights will tell you if your page has an element slowing down its LCP.
Performance Thresholds
Google evaluates these metrics at the 75th percentile of real-user page loads and categorizes results as "Good," "Needs Improvement," or "Poor."
Current Benchmarks for Each Core Web Vital
Metric | Good (Fast) | Needs Improvement | Poor (slow) |
| Largest Contentful Paint (LCP) | ≤ 2.5 seconds | 2.5 – 4.0 seconds | > 4.0 seconds |
| Interaction to Next Paint (INP) | ≤ 200 milliseconds | 200 – 500 milliseconds | > 500 milliseconds |
| Cumulative Layout Shift (CLS) | ≤ 0.1 (unitless) | 0.1 – 0.25 | > 0.25 |
Why Should Website Owners Care?
Why should a busy business owner or marketing manager care about a few milliseconds here or a layout shift there?
The answer is simple: On a website, milliseconds quickly add up to real-world business outcomes. Performance issues may sound technical, but they have a human impact on how visitors perceive and engage with your site and, by extension, how likely Google and AI tools are to surface your site in their results.
Improved SEO Visibility
Core Web Vitals are a confirmed Google ranking factor. That means if two sites have equally relevant content, the one with better page experience is likely to rank higher. Still, good CWV scores won’t magically shoot you to number one for competitive keywords. Content relevance still reigns supreme, but bad CWV scores can throttle your visibility even if your content is great.
Google's algorithm, increasingly enhanced by AI, strives to provide searchers with the most relevant results and the best experience. A slow, clunky site is a bad experience, so over time, it makes sense that Google would make page experience a part of its core ranking systems.
Better User Experience and Conversions
Rankings aside, speed and responsiveness are directly tied to user behavior. A fast site keeps people browsing; a slow site sends them packing. For instance, Google research found that conversions can drop by up to 20% for every one-second delay in mobile load.
That is huge.
Rankings aside, speed and responsiveness are directly tied to user behavior. A fast site keeps people browsing; a slow site sends them packing. For instance, Google research found that conversions can drop by up to 20% for every one-second delay in mobile load.
Future-Proofing with Page Experience
It's also worth noting that users' expectations are only going up as technologies advance.
We live in an age of lightning-fast information and AI assistants – people won’t wait for a sluggish website. Google’s direction with announcements like the Page Experience update and continuous Core Web Vitals updates (like the recent addition of INP) shows that performance remains central.
Emerging AI-driven search experiences favor websites that deliver quick, quality content since those provide better answers and user satisfaction. Investing in your site's core vitals now means you're not just reacting; you're making your site more resilient for the future of SEO, where user-centric metrics will continue to play a crucial role.
Other Important Web Vitals
While not part of Google's Core Web Vitals, these additional metrics offer valuable insight into how quickly your site responds and becomes usable for visitors.
Understanding them helps you fine-tune performance for a smoother user experience.
TTFB (Time to First Byte) and FCP
Time to First Byte (TTFB) and First Contentful Paint (FCP) aren’t Core Web Vitals, but they are still informative about your page’s user experience, as both measure the loading experience. TTFB measures the time between calling up the website and the first byte loaded by the web server, while FCP measures the time a display element is rendered in the browser for the first time.
When the first HTML has been received (i.e., the TTFB), the page is not nearly loaded yet on the screen. The FCP tells us more about the user experience because it indicates the time in milliseconds between requesting the page and when the first content-rich element is displayed on the page, which is more relevant to what the user experiences and sees happening as the page loads.
“Contentful” in this context means an HTML element with content, which excludes a formatting element such as an empty field or background color. But, a piece of text, an image (including a background image), an SVG or canvas would qualify.
A 'paint' happens whenever a browser puts something on the screen. Thus, the "First Contentful Paint" is the time from loading the page to when the first text or image is displayed.
TBT (Total Blocking Time) and TTI (Time to Interactive)
Google's Total Blocking Time (TBT) metric measures the time between FCP and Time to Interactive (TTI), referring to where the main thread was blocked for long enough to prevent input responsiveness. TBT is a great companion metric for TTI because it helps quantify the severity of a page's non-interactivity before its reliably interactive state.
The main thread is considered "blocked" any time there's a “long task,” defined as any task that runs on the main thread for more than 50 milliseconds (ms). We say the main thread is "blocked" because the browser cannot interrupt a task that's in progress. So, if a user interacts with the page in the middle of a long task, the browser must wait for the task to finish before it can respond.
If the task is long enough (e.g., anything above 50 ms), the user will likely notice the delay and perceive the page as sluggish or janky. The blocking time of a given long task is its duration in over 50 ms. The total blocking time for a page is the sum of the blocking time for each long task between FCP and TTI.
Tools to Measure Core Web Vitals
Luckily, there are free online tools from Google that you can use to measure the Core Web Vitals of your web pages and evaluate the quality of your website's page experience.
Google Search Console
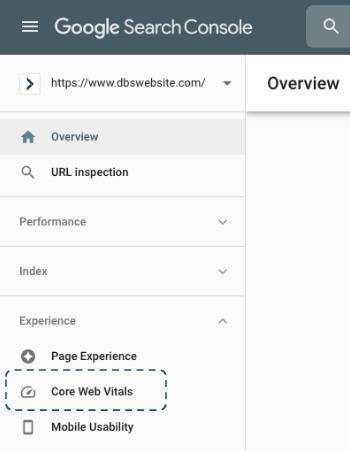
If you have Google Search Console activated and connected with your site, you can view aggregated Core Web Vitals scores for all of your pages in the "Experience" panel of the dashboard.
You can view Core Web Vital reports for the Desktop and Mobile versions of your site's pages, with links to the specific pages scoring Good, Needs Improvement, or Poor for any Core Web Vital metrics.
PageSpeed Insights
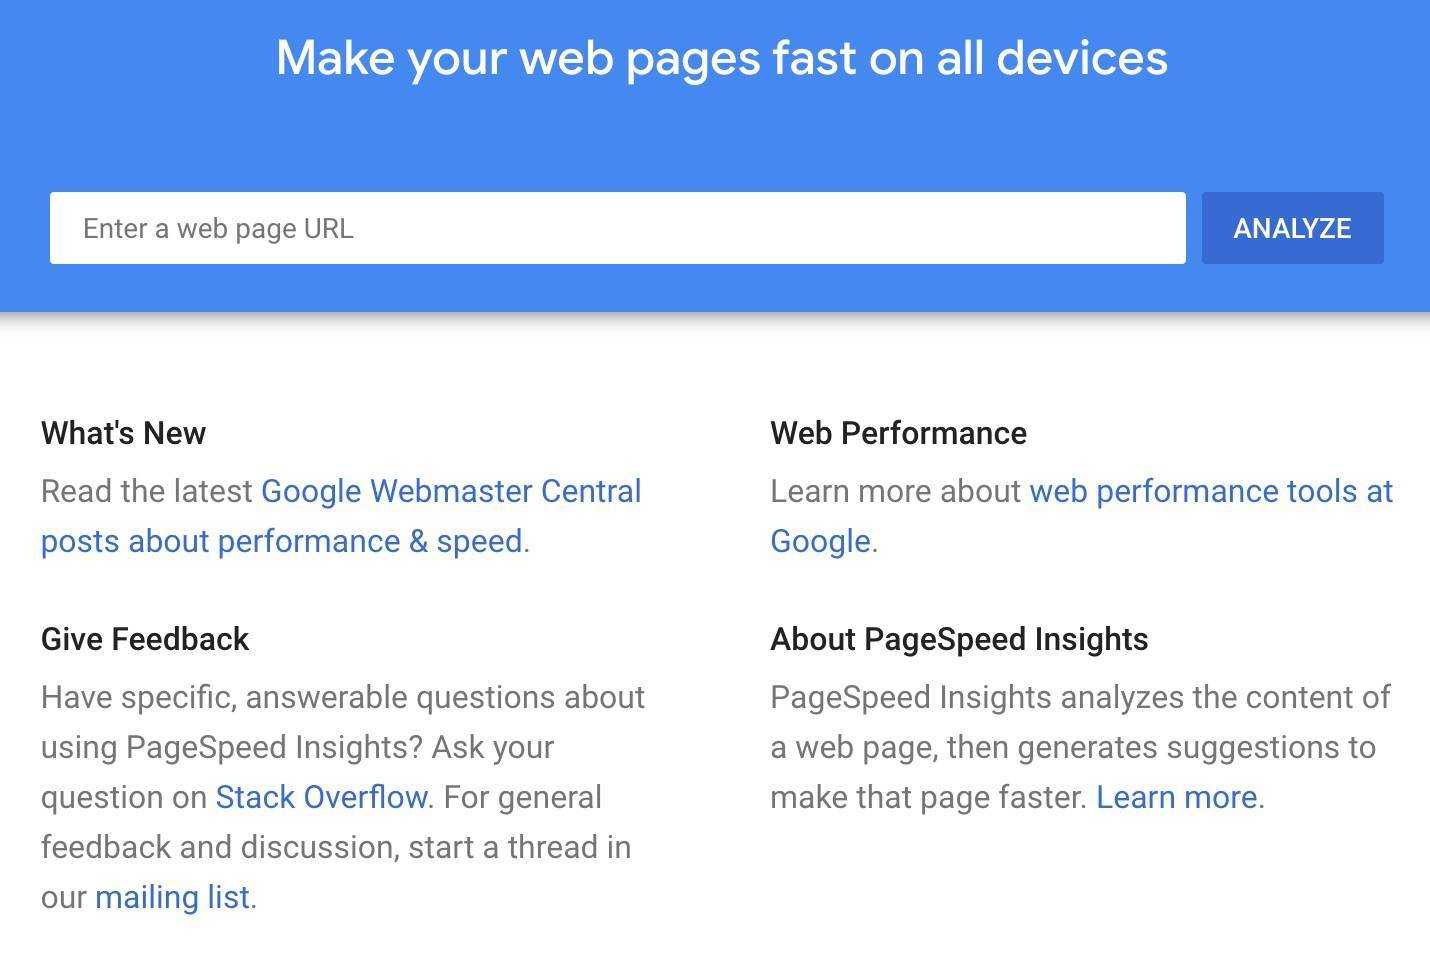
Google's PageSpeed Insights (PSI) tool reports on a page's lab and field performance on mobile and desktop devices.
The tool provides an overview of how real-world users experience the page (pulling its data from the Chrome UX Report) and a set of actionable recommendations on how a site owner can improve page experience.
The PSI results show whether or not your page meets the thresholds for a good page experience based on whether it passes or does not pass the Core Web Vitals assessment.
Lighthouse
Lighthouse is an automated website auditing tool that helps developers diagnose issues and identify opportunities to improve their sites' user experience. It measures several dimensions of user experience quality in a lab environment, including performance and accessibility.
It also measures all three Core Web Vitals and other components of your website's performance, including security and SEO.
Chrome DevTools
The Chrome DevTools Performance panel helps you detect unexpected layout shifts. This tool helps you find and fix visual instability issues on your page that contribute to its CLS score. CLS is a public dataset of real user experience data on millions of websites. It measures field versions of all the Core Web Vitals.
Using this data, developers can understand the distribution of real-world user experiences on their websites or competitors' sites. This type of measurement is commonly referred to as Real User Monitoring—or RUM for short. Even if you don't have RUM on your site, CrUX can provide a quick and easy way to assess your Core Web Vitals.
Web Vitals Chrome Extension
The Web Vitals Chrome extension measures the three Core Web Vitals metrics in real-time for desktop within Google Chrome. This helps catch issues early during your development workflow and as a diagnostic tool to assess the performance of Core Web Vitals as you browse the web.
Challenges Website Owners Face with Core Web Vitals
Improving Core Web Vitals isn’t always straightforward.
Many website owners encounter hurdles when optimizing their site's speed and usability. Some significant challenges and pain points make achieving good CWV scores difficult.
- Mobile Performance Issues: Ensuring fast load times on mobile devices is hard. Mobile networks can be slow, and phones have less processing power than desktops. Yet over half of web traffic is on mobile. Large images, unoptimized scripts, or a lack of mobile-first design can lead to poor LCP and INP on smartphones. A page that loads in 2 seconds on desktop might take 6 seconds on a typical phone, resulting in a bad SEO LCS (or LCP/CLS) performance on mobile. Many sites struggle with this disparity. Addressing it often requires techniques like responsive images (different sizes for mobile), eliminating render-blocking resources, and testing on real devices.
- Ad-Heavy or Analytics-Heavy Content: Monetization and tracking scripts can exact a cost on your vitals. Third-party ads, marketing tags, video embeds, and analytics scripts often load from external servers and can be blocked. They might delay the first interaction or shift content around (a top cause of high CLS is ad loading and pushing content down). Site owners face the balancing act of earning ad revenue vs. preserving a good user experience. Too many ads or poorly loaded ads can wreak havoc on page performance. Similarly, feature-rich pages with many pop-ups or widgets often end up with sluggish INP due to all the JavaScript. It’s a challenge to slim down a bloated page without sacrificing functionality or revenue streams.
- Limited Technical Resources: Not every business has a full-time web performance engineer. Small businesses and teams with limited dev resources struggle to diagnose and fix Core Web Vitals issues. Optimizing web vitals can get technical. It might involve diving into code, compressing files, setting up caching, or refactoring page structure. Many website owners simply don't have the time or expertise to do this deep optimization. Even knowing where to start can be overwhelming without guidance. This limitation often leads to performance issues remaining unresolved for long periods, even if the will to fix them is there.
- E-commerce and Platform Constraints: Sites built on heavy e-commerce platforms (like confident out-of-the-box shop builders or large CMS themes) frequently face CWV challenges. These platforms might include loads of default scripts, large theme assets, or plugins that slow things down. For example, an online store might use a theme that's not optimized, resulting in a slow Time to Interactive (TTI) and INP due to long product scripts running. While such platforms provide convenience and features, they can be less flexible in performance tuning. You might not have full control over code to implement best practices, and platform updates can introduce layout shifts or delays. Website owners on these systems often have to find creative workarounds or await platform improvements – which is frustrating when you know your site's speed is suffering in the meantime.
These challenges are real, but they’re not insurmountable.
Awareness is the first step. If you identify with any of the above, know that you’re not alone. Countless sites grapple with the same issues.
The key is to systematically address each area, for instance, by prioritizing mobile optimizations, auditing third-party scripts, and seeking outside technical help when needed.
Manufacturing, healthcare, and B2B websites are precision machines that must be maintained. Reviewing Core Web Vitals and Google Lighthouse Scores every month is one of the best practices for identifying problems before they get out of control.
Who Can Help Improve Core Web Vitals?
Elevating your site's performance to meet Google's new Core Web Vitals requirements can be overwhelming if you lack the right combination of technical SEO and web development expertise.
"Speed is not a feature; it’s the foundation of every great user experience," says Lead Developer John Golden.
A skilled agency partner will know the latest best practices for maintaining your performance to ensure a steady flow of inbound traffic from organic search results.
Improve Your CWV Work with DBS to align your site with Google metrics.
FAQs About Core Web Vitals
Core Web Vitals are a set of three performance metrics defined by Google: LCP (Largest Contentful Paint), INP (Interaction to Next Paint), and CLS (Cumulative Layout Shift). They measure the loading speed, interactivity, and visual stability of a page, indicating how fast and smooth your website feels to users.
Core Web Vitals are confirmed to be a Google ranking factor (under the “page experience” signals). This means if your site has poor CWV scores, it could rank lower in search results than it otherwise might. Improving these metrics can help your SEO, though they’re one of many factors.
You can measure Core Web Vitals using tools like Google PageSpeed Insights (for individual pages) and Google Search Console’s Core Web Vitals report (for site-wide data). PageSpeed Insights gives you both lab data (simulated performance) and field data (real-user metrics), including LCP, INP, and CLS values. Search Console will show which URLs on your site need improvement. Additionally, you can use the Lighthouse audit (built into Chrome DevTools) to get a detailed report with suggestions.
- LCP: ≤ 2.5 seconds
- INP: ≤ 200 milliseconds
- CLS: ≤ 0.1
INP stands for Interaction to Next Paint. It's a newer metric that assesses overall responsiveness by looking at all user interactions on a page and measuring the delay until the next frame is painted (giving visual feedback). Its predecessor FID, or First Input Delay, only measured the delay of the first interaction on a page (and only counted input delay, not the full response). INP is more comprehensive – it replaces FID as of 2024. In practical terms, INP gives a fuller picture of how your site responds to users beyond just the first click. A good INP is under 200 ms, whereas FID's threshold was 100 ms (but remember FID and INP are measured differently, so they aren't directly comparable).
Google evaluates both, but mobile performance is prioritized due to the dominance of mobile traffic.
No. Content quality, relevance, backlinks, and other technical SEO factors also matter. Core Web Vitals are one important part of the ranking equation.
Not by itself. But strong Core Web Vitals, combined with great content and links, give you a significant edge in SEO and user satisfaction.
Improvement starts with identifying what's slowing your pages down or causing instability. Common fixes include optimizing images (compressing them, using next-gen formats, lazy-load offscreen images), minifying and combining files, removing or deferring heavy third-party scripts, and optimizing your server response times. For better INP, focus on eliminating long tasks – break up or defer JavaScript work so the page can respond faster. To improve CLS, reserve space for images/ads and avoid inserting dynamic content without layout preparation. Tools like Lighthouse will suggest specific optimizations for your site. We also recommend reading up on best practices in our web performance testing articles or seeking help from professionals if needed. Each site is different, but almost every site can gain through these techniques. Even minor tweaks (like compressing a large image or caching a script) can boost your scores and contribute to a faster, more user-friendly experience.
Related Posts