Tackling the Emergence of AI Search with Our Latest AI Visibility Infographic
Learn how and why we made the AI Visibility Infographic exploring what it takes to show up in AI-generated results.
The inspiration for our interactive infographic exploring the growth of AI came from a real and rapidly intensifying pain point among business leaders and marketing managers.
The digital landscape for brand visibility has now become a dizzying, fragmented galaxy.
Thanks to AI, being seen is no longer about ranking in Google Search results.
Today, brands must navigate an ever-expanding universe of visibility opportunities—not only dozens of traditional search result types like featured snippets, local packs, and video carousels but also the rapidly multiplying platforms where people now conduct their research, including AI-powered tools like ChatGPT, Perplexity, Copilot, and Claude.
This dual explosion in result diversity and platform choice has made achieving a meaningful and visible online presence more complex and critical than ever.
Within the past year, Google introduced AI Overviews as the default search experience. Suddenly, many B2B businesses started noticing their website traffic isn’t what it used to be.
“They’re afraid the light at the end of this AI tunnel might be a speeding train.” Steve Fowler, Marketing Director at DBS Interactive
At first, panic set in. Was an entire audience of potential customers imploding right before our eyes?
We realized that many B2B marketers and CEOs are scared of this vast unknown. The sinking feeling that the organic lifeblood of new business was vanishing overnight set off alarm bells.
These rapid changes in search, the rise of AI-powered platforms, and the drop in traditional organic traffic have triggered profound and visceral anxiety among business leaders and marketers. That gut-wrenching sense of being caught off guard by forces beyond their control reflects just how disorienting this shifting landscape has become.
We approached this research with this emotional reality in mind.
Many are grappling not just with technical challenges, but with a deep-seated fear about their ability to navigate what feels like the uncharted territory of deep space.
What is actually happening is more nuanced.
We have seen it with our clients, and industry statistics validate our hypothesis.
- 89% of B2B buyers use generative AI for self-guided discovery [Forrester]
- 80% of B2B sales will be generated digitally [Gartner]
- 91% of buyers only connect with you after extensive independent research [Corporate Visions]
- 69% only interact with sales after making a decision [Salesforce]
The volume of visitors may have dipped, but the people still coming through the door are often more purposeful. Instead of a steady stream of casual visitors, businesses are seeing a higher concentration of genuinely interested, better-qualified prospects.
“B2B leaders worry about the drops in traffic they’re seeing, along with shifting buyer behaviors. They’re afraid the light at the end of the AI tunnel is a speeding train. They need information that shines a new light and helps them find a safe way forward,” said Steve Fowler, Director of Client Marketing at DBS Interactive.
The shift isn’t about your audience abandoning your brand. It’s about changes in how and where they search, ask questions, and engage. The result? Less noise, more meaningful conversations, and new metrics for what successful visibility looks like.
Yet the complexity and scale of opportunities and potential black holes make it alarmingly easy for even sophisticated teams to lose strategic focus and measurement clarity, or simply get overwhelmed.
Download the Free Essential Guide to Visibility
It quickly became clear there was no trusted visual guide mapping the many types of organic search results created through SEO, AISO, and GEO. This was a critical need as search and AI platforms now produce rich and diverse results, including classic organic listings, featured snippets, AI-powered answers, and generative summaries from tools like ChatGPT and Google’s AI Search.
Leaders and marketers were having to piece together scattered blogs and vendor materials without a unified expert resource showing how all platforms, result types, and strategies fit together.
The AHA! Moment

It quickly became clear there was no trusted visual guide mapping the many types of organic search results created through SEO, AISO, and GEO. This was a critical need as search and AI platforms now produce rich and diverse results, including classic organic listings, featured snippets, AI-powered answers, and generative summaries from tools like ChatGPT and Google’s AI Search.
Leaders and marketers were having to piece together scattered blogs and vendor materials without a unified expert resource showing how all platforms, result types, and strategies fit together.
Other Pain Points
- Skill and resource strain: Teams need mastery across SEO, AI content, analytics, UX, and technical disciplines, often not knowing where to focus or upskill next.
- Communication gaps: Marketing managers struggled to communicate this new, evolving reality to business leaders, who, pressured for results, needed actionable clarity—not another dense report or interminable deck.
We knew static content simply wouldn’t cut it.
An interactive infographic could bridge this gap by offering a complete visual library to the expanding universe of search visibility across SEO, AISO, and GEO.
The Big Idea: What the Infographic Would Do
We set out to create a tool that would do for B2B search and AI optimization what space maps do for explorers: Plot the whole organic universe at a glance, reveal hidden connections, and help you navigate uncertainty.
Goals of the Infographic
- Simplify the Complex: Visualize the tangled web of results, platforms, and disciplines.
- Empower Exploration: Let users dive as deep as they like, using interactive elements to reveal actionable “just the facts” insights.
- Build Strategic Clarity: Clearly indicate where and why an organization should invest in content, skills, or tools next.
- Bring It to Life Visually: Use branded animations, metaphors (black hole, cosmic journey, hydra, holy grail), and dynamic UI elements to enhance engagement and memory.
Research, Data Gathering, and Testing Theories
To understand the search landscape, we collected quantitative and qualitative information from users, studied data about how people behave online, and talked to marketing managers and top executives in B2B companies. We didn’t want the theme to obscure the information.
From this, we learned about common problems they face.
- Many are unsure which visibility numbers matter, especially as more AI and zero-click results change people's behavior.
- They also find it hard to decide how to use their resources effectively. Teams need many skills, from technical SEO to creating AI-friendly content. Plus, marketing teams and leaders often have trouble understanding each other and working toward the same goals.
Creative Storyboarding
We mapped the user journey, starting with the “why” and “what’s at stake.” Rather than a sterile lesson, we chose a range of compelling narrative metaphors to make the experience relatable and enjoyable.
- “The Hitchhiker’s Guide to Surviving the Big Bang of Search Visibility” for users who want to chart the evolving search cosmos.
- “Conquering the Visibility Hydra,” highlighting the multi-headed challenge of modern digital visibility.
- “Search for the Holy Grail of Visibility” or “Detective in Search of Visibility” for those who prefer epic quests or tactical investigation.
Ultimately, we opted for an experience built around a space exploration journey through the Black Hole of Complexity, with a user exploring the familiar “Solar System of Search” (classic SEO), through the mysterious “AI Nebula.
Building the Digital Experience
To bring the interactive infographic to life, we followed two parallel tracks that worked closely to ensure both design and content were aligned, purposeful, and impactful.
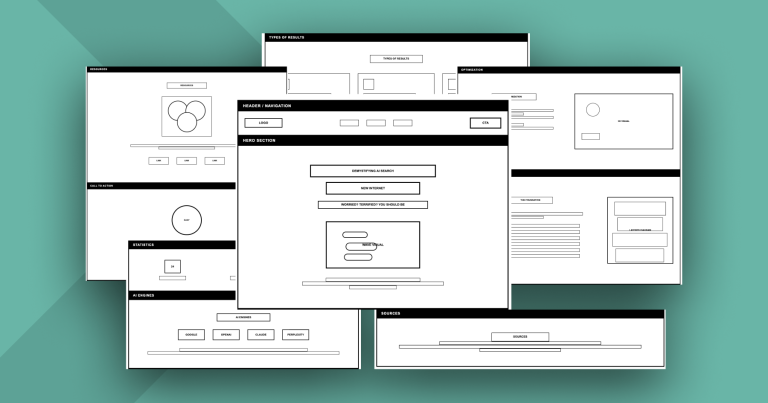
Framework, Wireframe, and Visual Development
Using initial descriptions and screenshots, we built wireframes and mockups to set interactions using visuals and text.
The design and development teams proceeded.
They built out the user interface and animations, leveraging technologies like React and canvas-based JavaScript for smooth, performance-friendly interactivity.
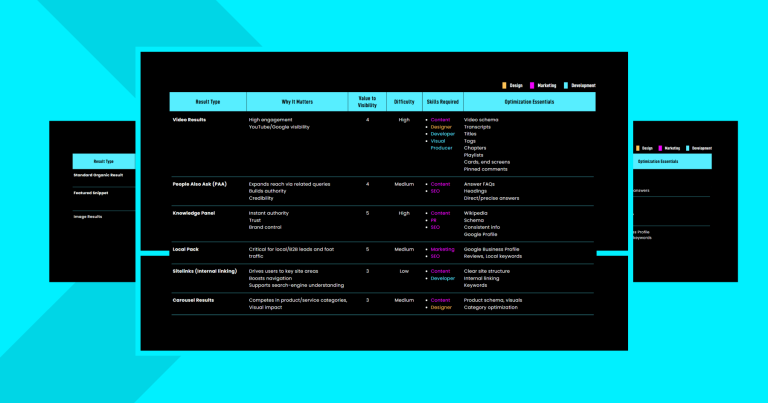
We also devised a scoring and evaluation system to assess every search result, measuring both business value and the difficulty in optimizing each type of result. This helped frame the complexity and opportunity for users.
Content Strategy and Writing
Given the infographic’s rich visual and interactive layers, the writing was crafted to be simple, clear, and direct—balancing and complementing the visual experience.
Content did more than just describe what users saw; it highlighted what each search result type does, why it matters, how to win that space, and which skills or disciplines are needed.
We focused on two key audiences—B2B executives and marketing leaders—tailoring content to speak to their pain points, motivations, and business goals. The writing emphasized simple descriptions, best practices, and layered explanations accessible via hovers or clicks.
The storytelling was precise and purposeful, with no fluff, only what was necessary.
Coding & Development
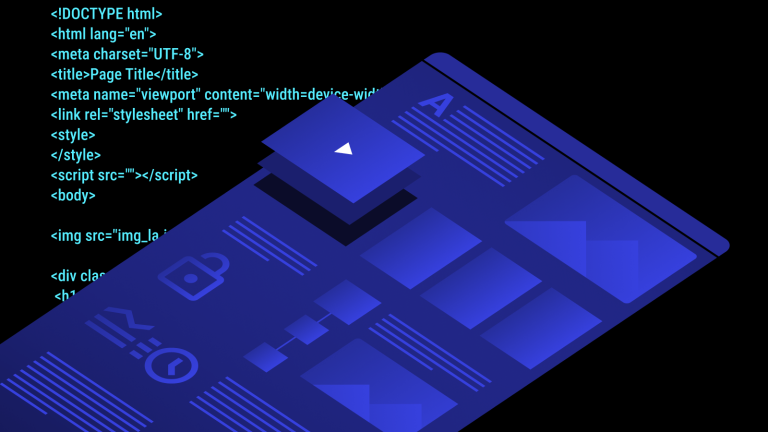
Bringing the space exploration vision to life required a technical approach as advanced and dynamic as the universe we were mapping.
Our development efforts became the engine room of this voyage, turning complex data and visuals into an immersive, interactive experience that users could explore intuitively, just like astronauts navigating unknown galaxies.
- Built in React for modular architecture and rapid updates, making it easy to add new “planets” (features or content) as the search landscape evolves.
- Implemented canvas-based JavaScript to power smooth, performance-driven animations—like waveforms and cosmic transitions—that evoke the feel of traveling through deep space.
- Prioritized accessibility, performance, and responsiveness so every device, from desktop command center to mobile scout, provided an equally stellar experience.
- Designed interactive grids and cards that served as star maps—letting users drill into specific platforms and result types, and even used filters by role (executive or marketer) to personalize their journey.
- Conducted rigorous QA and user testing across all browsers and devices, ensuring every explorer encountered a frictionless, reliable adventure.
This approach married technical rigor with our visual narrative, bringing the entire search universe to life in a beautiful and practical way.
It’s Alive!
Seeing a static mockup in a conference room, where everyone nods in approval, is one thing. But watching the design come alive in development is an entirely different—and exciting—experience.
Animations
The first visual sets an ominous, tech-forward tone with an animation of jittery headline text reminiscent of the iconic “Matrix” movie.
Next, a black hole consumes the headline. Words related to content and search are sucked into the black hole with a seemingly gravitational pull, only to be ejected, symbolizing the chaotic yet dynamic nature of digital visibility.
A pulsating sound waveform accompanies this, underscoring the presence and mystery of artificial intelligence at work.
The animations were created using the GSAP JavaScript library, formerly Greensock, along with canvas animations. GSAP allows precise control over smooth, detailed motion.
Canvas technology ensures these rich visuals run smoothly and handle dynamic effects like the pulsating waveform representing AI. The two libraries delivered an engaging experience that brought the complexity of digital visibility to life.
Download the Free Essential Guide to Visibility
Development Challenges
John Golden, the lead developer at DBS Interactive, highlighted some of the hurdles.
“Our challenge was balancing visuals with smooth performance. GSAP gave us control over timing and motion. Canvas handled the complex graphics. We updated only the parts of the canvas that changed and grouped animations into sequences. Hardware acceleration, synced with the browser’s refresh rate, ensured fluid motion, even on lower-end devices. This tuning helped bring the designer’s bold ideas to life without losing responsiveness or user experience.”
Navigation
Users, imagined as space travelers on this journey, have multiple ways to navigate their exploration.
- Continuous scrolling gradually reveals information, starting with key statistics that explain why search visibility is so important. As users move forward, more detailed insights and source information unfold, allowing them to build their understanding step by step.
- For those who prefer direct navigation, clearly labeled section links let users “beam” instantly to any point of interest or revisit earlier concepts.
Throughout the journey, a [navigation tracker name] keeps users oriented and on course, ensuring they never lose track as they explore the vast “universe” of search visibility insights.
Card Stacking
An early development version of the interactive infographic displayed each search result image and related content consecutively in a plain, endless scroll. That made for a very, very long journey.
To solve this, we introduced the stacking cards effect. Now, instead of endlessly scrolling through every detail, users move through a dynamic stack with each result appearing as a card that “floats” to the top of the pile as users progress.
This transformed the experience from a tedious scroll into an engaging, interactive exploration, almost like flipping through mission files in a futuristic control deck.
This keeps information organized and visually appealing, and it also helps users stay oriented and recall where they've been. The stacking motion gives the sense of moving forward through different “layers” of the search universe, making the experience feel purposeful and efficient, not overwhelming.
This approach turns complexity into clarity, ensuring that space travelers (our users) can review, compare, and revisit different search results quickly without ever feeling lost in a sea of content.
“The stacking effect isn’t just eye candy. It functionally guides users through dense information without fatigue. By layering each result like a card in a deck, we turned a long scroll into a sense of progression. It keeps context intact and transforms what could feel overwhelming into something fluid and fun,” Mr. Golden said.
Built for Today, Ready for What’s Next
The launch of our interactive infographic marked the start of an epic journey through the organic search and AI visibility. The guide maps the difficulty of each tactic, the skills needed to succeed, and the value of each result type.
It also creates visual, interactive experiences that educate and guide users toward action.
For visitors and clients, the value is straightforward: clear, actionable insights shown in a memorable way. The infographic helps users understand their current position, chart a path forward, and know when to seek expert help. It establishes our team as trusted guides in the expanding search and AI landscape.
This journey continues as the search universe evolves. We plan to add new platform insights, personalized assessments, and richer examples to keep clients ahead in this dynamic space.
DBS Interactive blends stunning design, digital marketing, and strategic optimization to help clients rise above the competition.
Related Posts