
Anyone responsible for managing digital for a business or organization is familiar with Google Analytics. It’s an extremely data rich platform, providing a wealth of information about your site’s audience and user actions. But the data in your Google Analytics dashboard is only as valuable as your ability to interpret and leverage it.
Of course, many agencies offer in-depth analytics support and reporting. Still, it’s valuable to understand the data you’re given. It is even more important for marketing managers and communication directors to be able to do some of their own analyses. One common request we hear is to explain Frequency and Recency.
This is exactly why we’re bringing you the Google Analytics Made Easy series. Explanations of the most telling data on your Google Analytics dashboard–easy to read, easy to understand, and without the fluff. Game on!
How Google Defines Frequency and Recency
Yes, “frequent” and “recent” users may sound self-explanatory, but Google often uses language differently than we do. Knowing exactly what that data represents is a key first step when using it to guide your digital strategy.
In Google Analytics, frequency refers to how often visitors return to your site within a time frame. You set the time frame manually, using the Date Range selection in the top right of your dashboard. Google is recording Sessions, or a visitor’s single website experience on a specific device. If a visitor came to your site three times in one week, Google would view and record those visits individually. One would be a “first session,” one would be a “second session,” and one would be a “third session.” Rather than lumping these sessions together into one “three-time visitor,” Google records three separate data points.
Recency refers to the length of time (in days) since a specific visitor last came to your site. Measured in days, this metric tracks a visitor’s last visit to your website on a specific device. If a visitor went to your site using her laptop on Monday, her iPhone on Tuesday, and her laptop again on Wednesday, she would be recorded twice. If you checked your analytics on Thursday, she would be counted twice: once for “days since last session” on her laptop and once for “days since last session” or her iPhone.
First: Where Do I Find Frequency & Recency?
On your Google Analytics dashboard, select the Audience category on the left. Click the Behavior drop-down, then select Frequency & Recency.

Find Frequency vs Recency in your Google Analytics dashboard
By default, you’ll see a screen that shows frequency data. Navigate between frequency (Count of Sessions) and recency (Days Since Last Session) using the two links near the top of the dashboard.
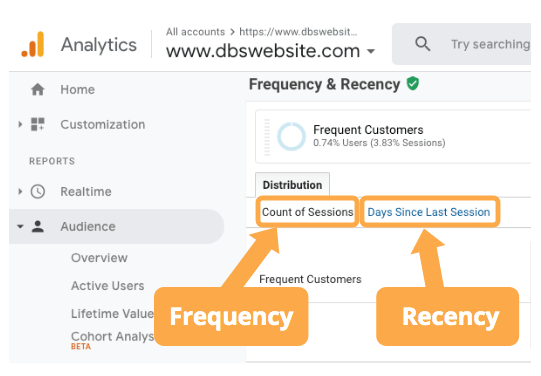
Click to easily navigate between Frequent and Recent visitors
How do I Analyze and Interpret Frequency & Recency Data?
Both frequency and recency give insight into the return value of your site. That is, does your website offer value on a visitor’s second, third, or twentieth visit? There’s no benchmark here to compare your own data against, as different websites are built with different strategies in mind. Sites with high-priority content strategies (like blogs, magazines, and publishing sites) should aim to have high frequency and low recency. In other words, they want visitors to keep coming back to their site more often.
On the other hand, websites built more as an online business card shouldn’t expect or pursue high frequency. Small service businesses, like salons and family restaurants, usually have websites that are merely informative. They expect visitors to come mainly for basic information like hours, menus, and location. If your website was built with this strategy in mind, you shouldn’t be frightened by low frequency or recency.
Sites designed specifically to drive sales (including e-commerce sites) probably fall somewhere in the middle. That’s because visitors often require multiple site visits before they convert into a sale or new lead. These visitors are likely either vetting your business or comparing you to your competitors. Visitors who only come once and don’t convert generally represent missed opportunities for your business. For businesses with these kinds of blended website strategies, the surface-level frequency and recency data provided in your basic Google Analytics dashboard is not enough.
How do I Create New Segments Based on Frequency & Recency?
To really dive deep into your frequency data, you’ll want to create Segments using specified frequency and recency buckets. Segments are audience groups in Google Analytics that allow you to see how specific types of users or customers interact on your site. Many casual Google Analytics users create segments based on demographic data, like age and gender. By creating more targeted segments using behavioral data, you gain a deeper understanding of site visitors that helps you improve your website or lead generation funnel and convert more traffic.
By default, your Google Analytics dashboard shows an All Users segment. To create a new Segment, you can click on the “Admin” button (You can also create segments on any other dashboard page or within the Admin function).
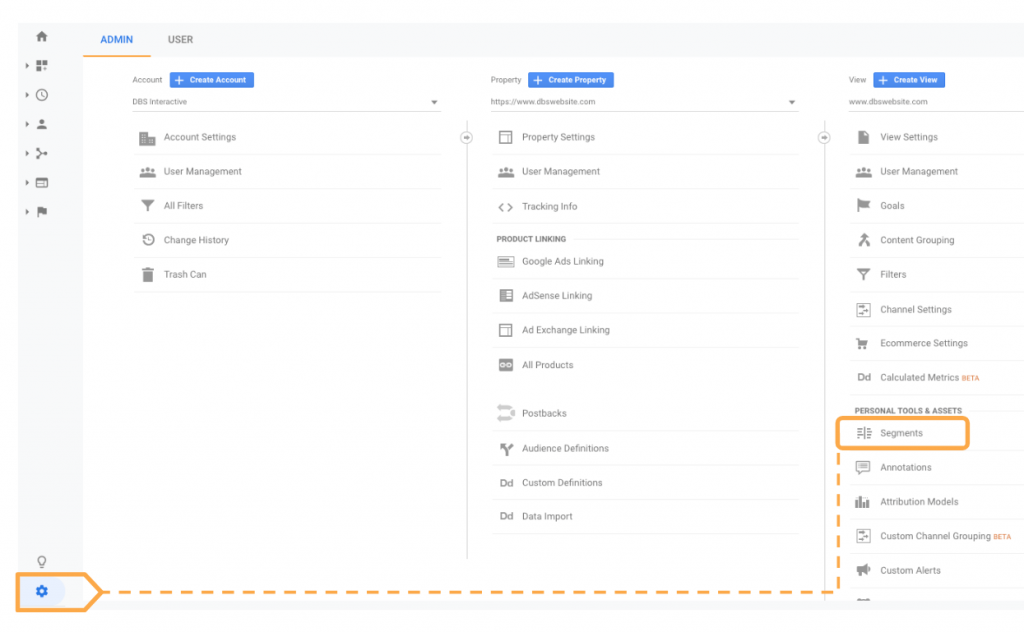
Open the Admin menu to add a New Segment
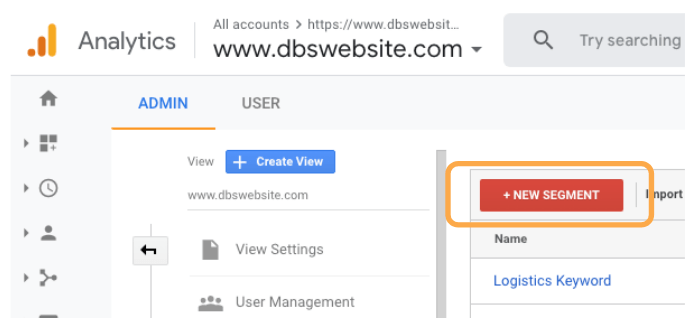
After clicking Segments, click “New Segment” button
Click on the red “+ New Segment” button. Name your new segment–in this case, I went with “Frequent Customers”–and set the criteria. Under the Behavior tab, I chose to segment customers who have visited in the last week and have also been to the site more than three times. Once you’ve set your own criteria, just click “Save” and you’re done!

Add parameters for frequency to your new Segment
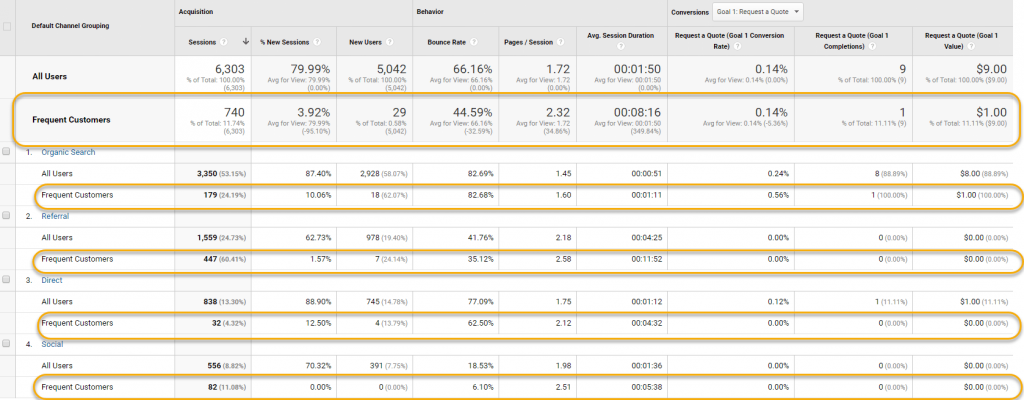
Navigate back to any of the reporting dashboards. In this case, I chose to look at Acquisition channels. I add in my recently created segment and can now compare my total user base with my frequent customers.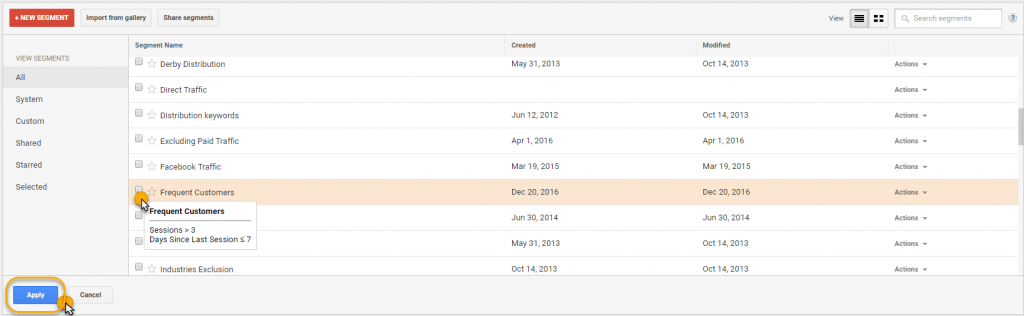
When you begin comparing segments, you may see some interesting trends emerge. For instance, the chart above shows that my frequent customers come more from Referrals than any other acquisition channel.
By diving into this data in detail, I can see what makes my frequent customers different than my average customer. Frequent customers may come to landing pages more than my homepage, signaling that my homepage might need adjustments to increase engagement. Or, I may see that my frequent customers are overwhelmingly older and viewing my site on desktop devices, which could signal either that my product appeals only to older buyers, or that my website is dated and needs to be refreshed.
This is the real benefit of frequency and recency data in Google Analytics. By segmenting your audience into groups that engage with your site in different ways, you can derive deep insights about what engages users and drives conversions on your website.
Quick Recap: Frequency and Recency
A key piece of behavioral data on your Google Analytics dashboard is the frequency and recency of visitors on your website. Frequency shows how often the same individual visits your site in a given time period. Recency tells you how long it’s been since your visitors last came to your site. By segmenting and analyzing this data, you can better understand what type of visitor is converting on your site, how long it takes for them to convert, and how your digital strategy can leverage these insights to capitalize on website visitor behaviors moving forward.
Interested in more of our Google Analytics tips? Check out Google Analytics Made Easy: New Visitors vs. Returning Visitors.
